USGS
Information Sources for the 1811-1812 New Madrid Earthquakes

- Title
- Information Sources for the 1811-1812 New Madrid Earthquakes
- Runtime
- 6:18
- Date posted
- 15 years ago
- Description
- Full details at: http://gallery.usgs.gov/videos/391
- Title
- Effects and Accounts of the 1811-1812 New Madrid Earthquakes
- Runtime
- 7:32
- Date posted
- 15 years ago
- Description
- Full details at: http://gallery.usgs.gov/videos/399

- Title
- Earthquake Features - Historic Evidence in Arkansas
- Runtime
- 4:46
- Date posted
- 15 years ago
- Description
- Full details at: http://gallery.usgs.gov/videos/398

- Title
- Tish Tuttle: Paleoseismology
- Runtime
- 4:31
- Date posted
- 15 years ago
- Description
- Full details at: http://gallery.usgs.gov/videos/390

- Title
- Lessons Learned About the New Madrid Fault Zone
- Runtime
- 4:07
- Date posted
- 15 years ago
- Description
- Full details at: http://gallery.usgs.gov/videos/397

- Title
- The Seismic Network in the Central U.S.
- Runtime
- 5:01
- Date posted
- 15 years ago
- Description
- Full details at: http://gallery.usgs.gov/videos/396

- Title
- Tish Tuttle: Prehistoric New Madrid Earthquakes
- Runtime
- 3:41
- Date posted
- 15 years ago
- Description
- Full details at: http://gallery.usgs.gov/videos/392

- Title
- Seismic Imaging the Central U.S.
- Runtime
- 2:25
- Date posted
- 15 years ago
- Description
- Full details at: http://gallery.usgs.gov/videos/389

- Title
- Jim Wilkinson: Upcoming events
- Runtime
- 1:51
- Date posted
- 15 years ago
- Description
- Full details at: http://gallery.usgs.gov/videos/401

- Title
- Earthquake Preparedness in the Central U.S.
- Runtime
- 3:19
- Date posted
- 15 years ago
- Description
- Full details at: http://gallery.usgs.gov/videos/395

- Title
- Jim Wilkinson: CUSEC
- Runtime
- 2:55
- Date posted
- 15 years ago
- Description
- Full details at: http://gallery.usgs.gov/videos/393

- Title
- Local Travel Time Tomography in the Central U.S.
- Runtime
- 3:46
- Date posted
- 15 years ago
- Description
- Full details at: http://gallery.usgs.gov/videos/400
- Title
- Earthquake Awareness and Seismic Retrofitting in the Central U.S.
- Runtime
- 2:28
- Date posted
- 15 years ago
- Description
- Full details at: http://gallery.usgs.gov/videos/394

- Title
- 3D Hazard Map, Attenuation in the Central U.S.
- Runtime
- 2:30
- Date posted
- 15 years ago
- Description
- Full details at: http://gallery.usgs.gov/videos/388

- Title
- USGS Oregon Science Podcast (Episode 2)
- Runtime
- 6:42
- Date posted
- 15 years ago
- Description
- Visit: http://bit.ly/mBx8Kr
Title: Shocking! Electrofishing for Largescale Suckers on the Columbia River
In this episode we take to the water and accompany a USGS field crew as they collect largescale suckers (Catostomus macrocheilus) along the lower Columbia River. Using a boat equipped with specialized shocking equipment, researchers stun nearby fish, allowing them to be easily collected and examined. Join us, as we explore how native fish are used to determine the water quality and ecological health of our local rivers, only in this month's episode of the Oregon Science Podcast.
- Title
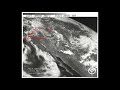
- Mount St. Helens 1980 Ash Cloud as Seen From Space
- Runtime
- 0:17
- Date posted
- 16 years ago
- Description
- On the USGS Multimedia Gallery: http://gallery.usgs.gov/videos/386
Eruptive activity at Mount St. Helens captured the world's attention on May 18, 1980 when the largest historical landslide on Earth and a powerful explosion reshaped the volcano. A volcanic ash cloud spread across the US in 3 days, and encircled the Earth in 15 days.
This mini-movie compiled from individual satellite images taken in 1980 shows the ash cloud as it enlarged, and was carried by winds across the western United States. Each photo identifies Mount St. Helens, some large cities, and the ash cloud. These satellite images are used courtesy of the National Oceanic and Atmospheric Administration (NOAA).
The first satellite picture was taken at 8:15 a.m. PDT, 17 minutes before the eruption. The next six pictures were taken every half hour until 11:15 a.m. PDT. Thereafter, images were taken every hour through 4:15 p.m. PDT.
Images taken on May 19, 198...
- Title
- Microgravity Measurement for Groundwater Analysis
- Runtime
- 4:24
- Date posted
- 16 years ago
- Description
- Full details at: http://gallery.usgs.gov/videos/380
A video discussing the Gravity Meters used at the USGS Arizona Water Science Center.

- Title
- Electronic Tape Calibration Procedure
- Runtime
- 3:05
- Date posted
- 16 years ago
- Description
- Full details at: http://gallery.usgs.gov/videos/379
A training video discussing how to calibrate the electronic tape.

- Title
- Flooding in Edwardsport, Indiana
- Runtime
- 1:00
- Date posted
- 16 years ago
- Description
- Cross-Posted from: http://gallery.usgs.gov/videos/377
This a video of flooding that took place in Edwardsport, Indiana, on April 26, 2011

- Title
- Microfossils Reveal Climatic History of the Gulf of Mexico
- Runtime
- 4:53
- Date posted
- 16 years ago
- Description
- Full details at: http://gallery.usgs.gov/videos/378
Proxy data such as tree rings, ice cores, and microorganisms are collected and analyzed by scientists to unlock past climate records stretching back thousands to millions of years ago. This video podcast examines how scientists can decipher past climate from such records by focusing on a proxy calibration study in the Gulf of Mexico. Microfossils recovered from the northern Gulf of Mexico are used to assess the control of temperature and salinity on the composition of microfossil assemblages and the chemical composition of their shells. The new data will be used to develop better estimates of past conditions from analyses of microfossils in sediment cores.

- Title
- Glenwood Canyon, Colorado: Interstate 70 Rockslide of November 25, 2004
- Runtime
- 1:31
- Date posted
- 16 years ago
- Description
- Cross-posted from: http://gallery.usgs.gov/videos/376
The rockslide occurred about nine miles east of Glenwood Springs in Glenwood Canyon (Colorado) at 7:42 am, November 25, 2004, according officials from the Colorado Department of Transportation (CDOT).
Glenwood Springs is about halfway between Vail and Grand Junction, Colorado. The rockslide caused the closure of Interstate 70 for rock removal and repair, and forced commercial trucks tourists and commuters to take a 200 mile detour, since it is the only highway through this rocky, steep canyon area of Interstate 70.
Colorado Department of Transportation Highway Surveillance Camera - the camera can be manipulated from a remote location, by Department of Transportation personnel.
Video provided Courtesy of Barry Siel, CDOT engineer
- Title
- New Brazoria Administration Building
- Runtime
- 3:29
- Date posted
- 16 years ago
- Description
- More information on the USGS Multimedia Gallery: http://gallery.usgs.gov/videos/375
This video gives a tour through the new Brazoria Administration Building. The tour highlights the new copy room, the new energy efficient systems used, and the wildlife the Refuge houses.

- Title
- Flood Conditions in Eagle Creek, Zionsville, IN
- Runtime
- 0:27
- Date posted
- 16 years ago
- Description
- This footage was gathered during peak water levels from the Zionsville Rd./High School Ave. bridge over Eagle Creek. At approximately 12:30 EST, when this video was taken, stream discharge was 4,740* cubic feet per second. This flood event is the second highest peak flow Eagle Creek has experienced this season to date. You can see historic streamflow levels, and real-time flow and water quality data for this site at: http://nwis.waterdata.usgs.gov/in/nwis/uv/?site_no=03353200
*Provisional data
- Title
- Flooding in French Lick, Indiana
- Runtime
- 1:40
- Date posted
- 16 years ago
- Description
- Video of flooding that took place located in French Lick, Indiana. This is a new USGS streamgage, near the Spring Resort & Casino.

- Title
- White River at Hazleton, IN, bank full conditions
- Runtime
- 0:28
- Date posted
- 16 years ago
- Description
- This video clip was captured from a boat while collecting water quality samples on the White River on April 20th, 2011. The gage height at the time was 17.39* feet and discharge was 32,900* cubic feet per second. The conditions seen here are considered bank full, which is the point at which the flow of the river completely fills river channel. Increased flow after bank full conditions cause water to spill over into adjacent floodplains. On April 27th, one week later, gage height was at 28.17* feet and discharge was measured to be 162,000* cubic feet per second, which exceeds the "high" threshold for this site. Learn more about this site, including checking on real-time water levels and water quality parameters at: http://nwis.waterdata.usgs.gov/in/nwis/uv/?site_no=03374100
*Provisional data

- Title
- USGS Turbid Bay
- Runtime
- 10:00
- Date posted
- 16 years ago
- Description
- More information on the USGS Multimedia Gallery: http://gallery.usgs.gov/videos/369
USGS scientists from the Pacific Coastal and Marine Science Center explore how sediment moves across San Francisco Bay tidal flats. The research team deploys a suite of large instrumented tripods to record sediment movements over a six-week period in early 2011. Answers from this work will help determine whether deposition of sediment at high tide is occurring quickly enough to preserve marshes in the face of sea-level rise.
The program also highlights the value and function of the USGS Mendenhall Fellowship Program. The Mendenhall Program at the USGS provides recent PhD graduates an opportunity to conduct cutting-edge research on pressing scientific questions with the guidance and mentoring of established scientists.

- Title
- Big Fork River at Big Falls, Minnesota, April 13, 2011
- Runtime
- 0:46
- Date posted
- 16 years ago
- Description
- USGS hydrologists recorded flood stage flow creating rapids on Big Fork River at Big Falls, MN on April 13, 2011
For more information about this flood and to view real-time streamflow information, go to http://mn.water.usgs.gov/

- Title
- Flood-Peak Inundation Map, Flood of September 2008, Deep River near Hobart, Indiana
- Runtime
- 1:08
- Date posted
- 16 years ago
- Description
- Fowler, K.K., Kim, M.H., Menke, C.D., and Arvin, D.V., 2010, Flood of September 2008 in Northwestern Indiana: U.S. Geological Survey Open File Report 2010--1098, 20 p.
Flood of September 2008 in Northwestern Indiana http://pubs.usgs.gov/ofr/2010/1098/
Illustrated inundated areas range from 0.1 (light blue) to 17.4 feet (dark blue) deep.
Appendix 2. Flood-Peak Inundation Maps for Selected Study Streams and Communities, Flood of September 2008, Indiana
Flood-peak inundation maps are intended to show the approximate depths and extents of floods using aerial photography as a base map. Error sources in the maps can include digital-elevation-data errors, high-water-mark errors, and flood water-surface elevation interpolation errors. Errors can result in inaccuracies in flood extent and depth estimations; thus, the flood extents and depths depicted in the maps should be considered estimates.
Effort was made to obtain c...

- Title
- Florida Keys National Marine Sanctuary
- Runtime
- 7:42
- Date posted
- 16 years ago
- Description
- More information on the USGS Multimedia Gallery: http://gallery.usgs.gov/videos/367
Former U.S. Geological Survey geologist Gene Shinn has been documenting coral reef conditions in the Florida Keys for 50 years. During those decades coral conditions have changed dramatically in the Caribbean and Florida Keys. Coral disease and bleaching events have led to the decline of certain types of coral species. Ocean acidification could lead to further impacts on coral reefs. These videos show Shinn snorkeling in the Keys on the 50th year since he began documenting coral reef conditions and taking photographs of coral reefs in their current state. Sea fans and gorgonian corals are seen in abundance in the area as well as various types of coral diseases such as black band disease.

- Title
- Florida Keys National Marine Sanctuary
- Runtime
- 2:24
- Date posted
- 16 years ago
- Description
- More information on the USGS Multimedia Gallery: http://gallery.usgs.gov/videos/366
Former U.S. Geological Survey geologist Gene Shinn has been documenting coral reef conditions in the Florida Keys for 50 years. During those decades coral conditions have changed dramatically in the Caribbean and Florida Keys. Coral disease and bleaching events have led to the decline of certain types of coral species. Ocean acidification could lead to further impacts on coral reefs. These videos show Shinn snorkeling in the Keys on the 50th year since he began documenting coral reef conditions and taking photographs of coral reefs in their current state. Sea fans and gorgonian corals are seen in abundance in the area as well as various types of coral diseases such as black band disease.
- Title
- Florida Keys National Marine Sanctuary
- Runtime
- 5:40
- Date posted
- 16 years ago
- Description
- More information on the USGS Multimedia Gallery: http://gallery.usgs.gov/videos/365
Former U.S. Geological Survey geologist Gene Shinn has been documenting coral reef conditions in the Florida Keys for 50 years. During those decades coral conditions have changed dramatically in the Caribbean and Florida Keys. Coral disease and bleaching events have led to the decline of certain types of coral species. Ocean acidification could lead to further impacts on coral reefs. These videos show Shinn snorkeling in the Keys on the 50th year since he began documenting coral reef conditions and taking photographs of coral reefs in their current state. Sea fans and gorgonian corals are seen in abundance in the area as well as various types of coral diseases such as black band disease.

- Title
- Climate Connections: Visiting Students in North Carolina
- Runtime
- 6:15
- Date posted
- 16 years ago
- Description
- Transcript will be available at: http://www.usgs.gov/corecast/details.asp?ep=152
America has questions about climate change, and the USGS has real answers. In this episode of Climate Connections, USGS scientists answer questions gathered from middle and high school students in Mt. Airy, NC.
- Do all scientists agree that climate change is occurring?
- Could climate change impact fishing?
- Will the climate change abruptly or slowly over time?
- What is geothermal energy and how does it impact the climate?

- Title
- Grand Falls
- Runtime
- 0:50
- Date posted
- 16 years ago
- Description
- More information on the USGS Multimedia Gallery: http://gallery.usgs.gov/videos/364
Flooding taking place at Grand falls.

- Title
- Ice breakup on the Skunk River at Augusta, IA
- Runtime
- 10:10
- Date posted
- 16 years ago
- Description
- More information on the USGS Multimedia Gallery: http://gallery.usgs.gov/videos/353
This video captures the breakup of ice cover on the Skunk River at Augusta, Iowa, on February 17, 2011, at approximately 3:00 pm CST. The river stage at the time was 14.50 feet (elevation 535.74 feet NGVD29). A preliminary estimate of the discharge at the time of the ice breakup is 9,500 cubic feet per second.
The USGS has operated a streamgage on the Skunk River at Augusta since 1913. The streamgage is located on the left bank of the river, just upstream of the County Highway X38 bridge in Augusta, and 10.4 miles upstream from where the Skunk River flows into the Mississippi River. The Skunk River watershed, encompassing 4,355 square miles, stretches from its headwaters in central Iowa near Williams to the southeastern corner of Iowa south of Burlington. In addition to real-time stage and flow, the USGS also collects a daily record of suspended sediment concentration and r...

- Title
- Outstanding In the Field
- Runtime
- 2:48
- Date posted
- 16 years ago
- Description
- More information on the USGS Multimedia Gallery: http://gallery.usgs.gov/videos/358
Video narrated by Amy Macleod, USGS Wildlife Biologist Research Assistant at the West Glacier Field Station in Montana, on the making of the scent lures for the Northern Divide Bear Project. Scent lures are concoctions made from decomposing fish and cows blood. The scent lure is wretchedly stinky and making it is one of the dirtiest jobs in the USGS. Scent lures are used to attract bears to hair snag stations. The collected hair is used in DNA analysis. The DNA analysis is sued by USGS researchers to determine the population of bears in the Northern Continental Divide Ecosystem.

- Title
- Potential Effects of Elevated CO2 and Climate Change on Coastal Wetlands
- Runtime
- 12:41
- Date posted
- 16 years ago
- Description
- More information on the USGS Multimedia Gallery: http://gallery.usgs.gov/videos/357
This video provides an overview of direct and indirect effects of increases in atmospheric CO2 on coastal wetlands using a salt marsh-mangrove community as an example. A short background is given summarizing past, present, and future predicted changes in CO2 concentrations based on ice core data and direct measurements conducted at monitoring stations such as the Mauna Loa Observatory. Responses of plants utilizing different photosynthetic pathways (C3 vs. C4 species) are used as a starting point to explain potential responses of a coastal plant community containing Avicennia germinans (C3 mangrove) and Spartina alterniflora (C4 grass) to changes in CO2 and associated climate change (temperature, rainfall). Experimental methods used to study effects of CO2 on plants are described, and results of peer-reviewed studies are summarized to illustrate the complexity of potential effects of CO...

- Title
- Seepage Investigation: Clear Creek and Little Colorado River
- Runtime
- 4:22
- Date posted
- 16 years ago
- Description
- More information on the USGS Multimedia Gallery: http://gallery.usgs.gov/videos/354
Stream gaging occurring in Winslow: Clear Creek and Little Colorado River.

- Title
- WRF Model Output: Cloud-top Temperature Simulation
- Runtime
- 0:27
- Date posted
- 16 years ago
- Description
- More information on the USGS Multimedia Gallery: http://gallery.usgs.gov/videos/300
Cloud-top temperature simulation for Arctic Alaska
- Title
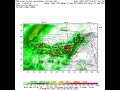
- WRF Model Output: Total Precipitation Simulation
- Runtime
- 0:27
- Date posted
- 16 years ago
- Description
- More information on the USGS Multimedia Gallery: http://gallery.usgs.gov/videos/301
Total precipitation simulation for Arctic Alaska

- Title
- WRF Model Output: Total Precipitation Simulation
- Runtime
- 0:27
- Date posted
- 16 years ago
- Description
- More information on the USGS Multimedia Gallery: http://gallery.usgs.gov/videos/302
Total precipitation simulation for Arctic Alaska

- Title
- WRF Model Output: Surface Air Temperature Simulation
- Runtime
- 0:54
- Date posted
- 16 years ago
- Description
- More information on the USGS Multimedia Gallery: http://gallery.usgs.gov/videos/303
Surface air temperature simulation for Arctic Alaska

- Title
- Drew Point, AK Time-Lapse Photography of Coastal Erosion
- Runtime
- 0:39
- Date posted
- 16 years ago
- Description
- More information on the USGS Multimedia Gallery: http://gallery.usgs.gov/videos/304
4-week time-lapse photography of the Arctic coast at Drew Point, AK shows intense coastal erosion in early July, 2008
- Title
- Drew Point, AK Time-Lapse Photography of Coastal Erosion
- Runtime
- 0:32
- Date posted
- 16 years ago
- Description
- More information on the USGS Multimedia Gallery: http://gallery.usgs.gov/videos/305
4-week time-lapse photography of the Arctic coast at Drew Point, AK shows mass wasting of the coastal sediments in July, 2008

- Title
- Lake 31, NPR-A, AK Time-Lapse Photography of Lake Shore Erosion
- Runtime
- 0:18
- Date posted
- 16 years ago
- Description
- More information on the USGS Multimedia Gallery: http://gallery.usgs.gov/videos/306
4-week time-lapse photography of the shoreline of Lake 31 in NPR-A, coastal Arctic Alaska, demonstrates erosion mechanisms during July, 2008

- Title
- Ice Jam on the Little Nemaha River at Auburn, Nebraska
- Runtime
- 1:07
- Date posted
- 16 years ago
- Description
- More information on the USGS Multimedia Gallery: http://gallery.usgs.gov/videos/352
A 1-minute video shows ice flows on the Little Nemaha River at the streamgaging station at Auburn, Nebraska.

- Title
- Elk City Fuels Reduction
- Runtime
- 3:40
- Date posted
- 16 years ago
- Description
- More information on the USGS Multimedia Gallery: http://gallery.usgs.gov/videos/326
The BLM and a community group partnered to reduce hazardous fuels in the wildland urban interface around Elk City, Idaho through an assistance agreement funded with an ARRA allocation.

- Title
- Pitchfork Ranch
- Runtime
- 3:11
- Date posted
- 16 years ago
- Description
- More information on the USGS Multimedia Gallery: http://gallery.usgs.gov/videos/332
The project is to return the functionality of the burro cienega to its functionality of 150 years ago. With the Partner's program they will have installed 150, maybe 200 grade control structures over the 8.6 mile reach of the Burro Cienega that's on Pitchfork ranch as tier one. By tier four the cienega will be built. As a result, when the water comes down and spreads out it will be a football field wide instead of 6 inches wide.
- Title
- Channelized Lava Flow
- Runtime
- 0:38
- Date posted
- 16 years ago
- Description
- More information on the USGS Multimedia Gallery: http://gallery.usgs.gov/videos/339
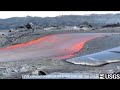
A channelized flow that broke out of the lava tube early this morning at the base of the pali, west of Kalapana. Even after traveling through the lava tube system for almost 10 kilometers (about 6.2 miles), the lava is sufficiently hot to be extremely fluid, and moves swiftly downslope. For scale, the channel is about 2 meters (about 2 yards) wide.

- Title
- Pu'u 'O'o Producing Spattering
- Runtime
- 1:11
- Date posted
- 16 years ago
- Description
- More information on the USGS Multimedia Gallery: http://gallery.usgs.gov/videos/338
The flow began erupting in Pu'u 'O 'o crater this morning. The primary vent for the flow was producing small pulsating spattering that had built a small rampart on its south side. The final portion of the video is shown at x10 speed with a wide view, and shows how the spattering vent is supplying the flow.

- Title
- East Lae'apuki Lava Delta Collapse
- Runtime
- 0:34
- Date posted
- 16 years ago
- Description
- More information on the USGS Multimedia Gallery: http://gallery.usgs.gov/videos/337
At 11:10 in the morning on November 28, 2005, the active lava delta at East Lae'apuki began to fall into the ocean. This was not a catastrophic collapse, with the entire 34-acre delta going at once, but instead occurred in a piece-meal fashion over a period of just less than 5 hours. The collapse removed the active East Lae'apuki delta, plus another 10 acres of the old sea cliff inland from the delta. The area of land removed was 830 meters long and 320 meters wide--this is more than half a mile long and just under a quarter mile wide!