NWSMiami
Surveying the Aftermath: Milton

- Title
- Surveying the Aftermath: Milton
- Runtime
- 12:24
- Date posted
- 2 years ago
- Description
- Robert Molleda, Meteorologist-In-Charge at NWS Miami walks viewers through the intricacies of tornado surveying and how tornadoes are rated based on the damage produced.

- Title
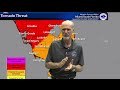
- Hurricane Milton Tornado Outbreak Overview
- Runtime
- 3:37
- Date posted
- 2 years ago
- Description
- Anthony Reynes, Lead Meteorologist at NWS Miami leads viewers through a walkthrough of how the historic tornado outbreak of Hurricane Milton unfolded across South Florida.

- Title
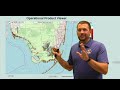
- Hurricane Milton Tornado Outbreak Analysis
- Runtime
- 10:54
- Date posted
- 2 years ago
- Description
- Donal Harrigan, NWS Miami Science and Operations Officer takes a closer look at the ingredients that led to a prolific tornado outbreak across South Florida associated with Hurricane Milton on October 9th 2024.

- Title
- NWSMiami Live Stream
- Runtime
- 0:00
- Date posted
- 2 years ago
- Description

- Title
- Test NWS
- Runtime
- 0:00
- Date posted
- 2 years ago
- Description
- Test NWS
- Title
- Web Update - Tornadoes / Hurricane Milton 10/9/2024 11pm
- Runtime
- 7:11
- Date posted
- 2 years ago
- Description
- Web Update - Tornadoes / Hurricane Milton 10/9/2024 11pm
- Title
- Web update Hurricane Milton - Oct 9, 2024 - 230pm
- Runtime
- 6:06
- Date posted
- 2 years ago
- Description

- Title
- Evening Update - October 8, 2024
- Runtime
- 4:35
- Date posted
- 2 years ago
- Description
- Web update on powerful hurricane Milton

- Title
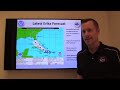
- 3:30pm Tuesday Sept 24th - Social Media Briefing for Tropical Storm Helene
- Runtime
- 4:00
- Date posted
- 2 years ago
- Description
- Good Afternoon South Florida!👋
Here is a quick four minute briefing on Tropical Storm #Helene as of 3:30pm from our Meteorologist-In-Charge Robert Molleda.
The next advisory on Helene will be issued by the National Hurricane Center at 5pm.
![[Español] Como comprender y utilizar el gráfico de posibles inundaciones por marejadas ciclónicas](https://i.ytimg.com/vi/_6p9tSVxknQ/1.jpg)
- Title
- [Español] Como comprender y utilizar el gráfico de posibles inundaciones por marejadas ciclónicas
- Runtime
- 1:27
- Date posted
- 2 years ago
- Description
- Este video describe cómo utilizar el gráfico de posibles inundaciones por marejadas ciclónicas para comprender el riesgo de inundaciones por marejadas ciclónicas en su vecindario. Las visualizaciones muestran cómo podrían verse las inundaciones en diferentes niveles de inundación. Los colores representados en el mapa corresponden a los colores utilizados en el mapa de posibles inundaciones por marejadas ciclónicas elaborado por el Centro Nacional de Huracanes de EE.UU. (NHC por sus siglas en inglés) cuando existe una amenaza por marejadas ciclónicas en los EE. UU.

- Title
- Behind the Scenes: Port Meteorological Officer (PMO)
- Runtime
- 1:46
- Date posted
- 2 years ago
- Description
- Did you know that NWS Miami has a Port Meteorological Officer? Port Meteorological Officers (PMOs) support observing programs aboard Voluntary Observing Ships. They are responsible for recruitment of new vessels as observers, and also for ensuring the quality of observations from vessels actively participating in the program. PMOs spend a major part of their time visiting ships, primarily assisting deck officers with marine weather observation practices, weather codes, and report transmission procedures. They distribute observing forms, handbooks, and operating instructions, in addition they also calibrate some of the weather instrumentation. The PMO will review completed observation forms on board, point out omissions or errors, and suggest methods for improvement. They maintain contact with ship owners and agents, port operators, shore radio stations, and maritime academies to secure the cooperation of the maritime community.

- Title
- Hurricane Preparedness - Understanding the Potential Storm Surge Flooding Map #stormsurge #hurricane
- Runtime
- 0:57
- Date posted
- 2 years ago
- Description
- This video describes how to use the potential storm surge flooding to understand the risk of storm surge flooding in your neighborhood. The visualizations depict what the flooding could look like at different inundation levels. The colors represented on the map correspond to the colors used in the potential storm surge flooding map produced by the National Hurricane Center when storm surge poses a threat to U.S. locations.

- Title
- Hurricane Preparedness - Understanding the Potential Storm Surge Flooding Map
- Runtime
- 0:56
- Date posted
- 2 years ago
- Description
- This video describes how to use the potential storm surge flooding to understand the risk of storm surge flooding in your neighborhood. The visualizations depict what the flooding could look like at different inundation levels. The colors represented on the map correspond to the colors used in the potential storm surge flooding map produced by the National Hurricane Center when storm surge poses a threat to U.S. locations.

- Title
- Oceans Today: Rip Current Science
- Runtime
- 1:40
- Date posted
- 2 years ago
- Description
- Transcript:
You might have heard them referred to as “undertow” or “rip tides,” but these ocean phenomena are actually rip currents.
Rip currents are narrow currents in the surf zone that move quickly away from shore.
A typical rip current ranges from 50-100 feet wide, and can extend 100 yards or more offshore. It can reach speeds of over 5 miles per hour - that’s faster than an Olympic swimmer!
That makes them dangerous and potentially deadly, and scientists want to learn more about them so we can better forecast when and where they will form - and keep beachgoers safe.
Here’s what we know:
Waves don’t have to be huge for a rip current to form - two or three feet are all it takes.
And the weather doesn’t have to be bad for a rip current to emerge. They often occur in the nice days after a storm.
They’re usually strongest near low tide, but can form at any time.

- Title
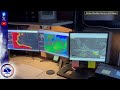
- Demonstration of Convective Warning Evolution at NWS Miami
- Runtime
- 0:43
- Date posted
- 2 years ago
- Description
- A short demonstration on convective warning evolution at the National Weather Service Miami.

- Title
- First Person View: Sunrise Weather Balloon Launch
- Runtime
- 1:22
- Date posted
- 2 years ago
- Description
- #DYK: These balloon flights can last for around 2 hours, drift up to 125 miles away, and rise up to over 100,000 feet (about 20 miles) in the atmosphere!
- Title
- A glance into operations at the Center Weather Service Unit Miami
- Runtime
- 1:27
- Date posted
- 2 years ago
- Description
- A brief tour/background on the Center Weather Service Unit Miami, an operational unit of 4 meteorologists who provide support to the Federal Aviation Administration at the Miami Air Route Traffic Control Center.

- Title
- A glance into operations at NWS Miami
- Runtime
- 0:57
- Date posted
- 2 years ago
- Description
- In this short 1 minute video, join us as we take a quick look around the operations floor of NWS Miami and a few of the many tools our meteorologists use to predict and forecast the weather.

- Title
- Miami Radar Tour (KAMX WSR-88D)
- Runtime
- 1:52
- Date posted
- 3 years ago
- Description
- Join us as we take a tour of the Miami WSR-88D (KAMX) which is the primary weather radar located in South Florida. Installed in April 1993 and commissioned in 1995, KAMX has been working non-stop 24/7 365 days of the year to help meteorologists track the weather and issue alerts and warnings to protect life and property.

- Title
- Andrew Revisited - Part 5 (available in High Definition)
- Runtime
- 12:05
- Date posted
- 4 years ago
- Description
- Part 5: The Road to Homestead. In this final installment we take a trip southward, straight into ground zero at the heart of Homestead, Fl. A grim reminder of the importance of being prepared and have an emergency response plan in place for your family.

- Title
- Andrew Revisited - Part 4 (available in High Definition)
- Runtime
- 11:32
- Date posted
- 4 years ago
- Description
- Part 4: The Dawn of Destruction. South Florida wakes up to face the aftermath of Andrew. Most south floridians, however, were still unaware of the catastrophe still unfolding at Homestead, where the full fury of Andrew was unleashed.

- Title
- Andrew Revisited - Part 3 (available in High Definition)
- Runtime
- 9:03
- Date posted
- 4 years ago
- Description
- Part 3: As Meteorologists hunker down in Coral Gables, Stormchaser Steve Wachholder pulls into a parking lot in Coconut grove and records unprecedented footage of the sight and sound of a major hurricane at landfall.

- Title
- Andrew Revisited - Part 2 (available in High Definition)
- Runtime
- 6:26
- Date posted
- 4 years ago
- Description
- Part 2: Meteorologists gear up for a night they will never forget at the Gables 1 Tower in Coral Gables, Miami. Join us a we commemorate the 30th Anniversary of Hurricane Andrew.

- Title
- Andrew Revisited - Part 1 (available in High Definition)
- Runtime
- 5:37
- Date posted
- 4 years ago
- Description
- Part 1: revisiting the most memorable hurricane in South Florida's modern history. Join us as we commemorate the 30th Aniverssary of hurricane Andrew with a 5-part revision of our database of Andrew video-memorabilia.

- Title
- Hurricane Andrew 1992 GOES-7 Visible Satellite Imagery (1 km)
- Runtime
- 1:06
- Date posted
- 4 years ago
- Description
- GOES-7 Visible 1 km satellite animation for Hurricane Andrew in August 1992. Animation courtesy of Donovan Landreneau of NWS Lake Charles, LA. The satellite animations were created using data from the NOAA Comprehensive Large Array-data Stewardship System (CLASS) and processed using the NOAA Weather and Climate Toolkit.

- Title
- Hurricane Andrew 1992 GOES-7 Visible satellite imagery (4 km)
- Runtime
- 1:03
- Date posted
- 4 years ago
- Description
- GOES-7 4-km Visible satellite animation for Hurricane Andrew in August 1992. Animation courtesy of Donovan Landreneau of NWS Lake Charles, LA. The satellite animations were created using data from the NOAA Comprehensive Large Array-data Stewardship System (CLASS) and processed using the NOAA Weather and Climate Toolkit.

- Title
- Hurricane Andrew 1992 7 km GOES-7 IR (Infrared) Imagery
- Runtime
- 1:31
- Date posted
- 4 years ago
- Description
- GOES-7 IR (Infrared) satellite animation for Hurricane Andrew in August 1992. Animation courtesy of Donovan Landreneau of NWS Lake Charles, LA. The satellite animations were created using data from the NOAA Comprehensive Large Array-data Stewardship System (CLASS) and processed using the NOAA Weather and Climate Toolkit.

- Title
- Hurricane Andrew 1992 Radar Animation from NWS Melbourne, FL
- Runtime
- 0:25
- Date posted
- 4 years ago
- Description
- Radar animation from Melbourne, FL (KMLB) WSR-88D radar at landfall. Animation courtesy of Donovan Landreneau of NWS Lake Charles, LA. Radar animations were created using data from: National Centers for Environmental Information (NECI), Amazon Web Services (AWS), and digitized VHS tape of NOAA/AOML/HRD Hurricane WSR-57 Radar Imagery Animations.

- Title
- Hurricane Andrew 1992 Radar Animation at Landfall in Miami, FL
- Runtime
- 0:07
- Date posted
- 4 years ago
- Description
- Radar animation from Miami, FL (MIA) WSR-57 radar at landfall. Radar equipment was destroyed seconds after the last image. Animation courtesy of Donovan Landreneau of NWS Lake Charles, LA. Radar animations were created using data from: National Centers for Environmental Information (NECI), Amazon Web Services (AWS), and digitized VHS tape of NOAA/AOML/HRD Hurricane WSR-57 Radar Imagery Animations.

- Title
- Wave Detail Experiment - NOAA/National Weather Service (available in HD)
- Runtime
- 7:00
- Date posted
- 4 years ago
- Description

- Title
- Wave Detail Experiment - NOAA/National Weather Service (available in HD)
- Runtime
- 7:00
- Date posted
- 4 years ago
- Description

- Title
- Evening Weather Balloon Timelapse at NWS Miami
- Runtime
- 0:53
- Date posted
- 4 years ago
- Description
- Join one of NWS Miami’s Meteorologists as they prep and launch the evening weather balloon.
- Title
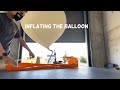
- Behind the Scenes at NWS Miami: Weather Balloon Launch
- Runtime
- 0:43
- Date posted
- 4 years ago
- Description
- Join one of NWS Miami’s Meteorologists as they prep, fill, and launch a weather balloon!

- Title
- Hurricane Threats and Impacts Graphics - Going Beyond the Cone
- Runtime
- 2:57
- Date posted
- 5 years ago
- Description
- Many people are familiar with the National Hurricane Center's forecast cone, or cone of uncertainty graphic. While that graphic provides general information about a storm's forecast track and intensity, it does not provide specific, local information on the storm's hazards such as wind, storm surge, rainfall flooding, and tornadoes.
So where can you find more specific storm information for your community? NWS local forecast offices such as ours in Miami produce "Hurricane Threats and Impacts" graphics that give a greater picture of potential storm impacts. This video describes these graphics in more detail, as well as where to find these when storms threaten your area.
NWS Miami website: https://www.weather.gov/mfl/
NWS Tropical Webpage: https://www.weather.gov/srh/tropical?office=mfl
This video is available in high definition 1080p.

- Title
- Tropical Cyclone: Time Of Arrival Graphic
- Runtime
- 7:17
- Date posted
- 6 years ago
- Description
- A detailed description of the Time of Arrival Graphic and how it should be used.

- Title
- Hurricane Hazards
- Runtime
- 3:39
- Date posted
- 6 years ago
- Description
- Learn more about Hurricane Hazards

- Title
- South Florida Hurricane Climatology
- Runtime
- 3:45
- Date posted
- 6 years ago
- Description
- An overview of South Florida Hurricane Climatology

- Title
- NWS Miami SPECIAL EMERGENCY MESSAGE
- Runtime
- 0:59
- Date posted
- 9 years ago
- Description
- Hurricane Irma expected to bring LIFE-THREATENING SURGE to the Southwest Florida Gulf Coast.

- Title
- NWS Miami Web Briefing for Hurricane Irma at 8 pm Sep 8, 2017
- Runtime
- 1:43
- Date posted
- 9 years ago
- Description

- Title
- NWS Miami briefing on Hurricane Irma, Friday morning September 8, 2017
- Runtime
- 2:33
- Date posted
- 9 years ago
- Description

- Title
- NWS Miami Web Report for Hurricane Irma: 5pm Thursday Sept. 7th
- Runtime
- 2:15
- Date posted
- 9 years ago
- Description

- Title
- NWS Miami Presents - Hurricane Andrew: 25th Anniversary
- Runtime
- 1:00:55
- Date posted
- 9 years ago
- Description
- Available on HD-1080p. Commemorating the 25th Anniversary of the hurricane event that changed South Florida for ever. Come join us in this trip to the past, 25 years ago and listen to the stories from people who experienced it first hand and survived.

- Title
- screenCapture
- Runtime
- 0:03
- Date posted
- 9 years ago
- Description

- Title
- NWS Miami Hispanic Heritage Month
- Runtime
- 2:54
- Date posted
- 10 years ago
- Description
- The Hispanic staff from the NWS Miami thanking the South Florida community for their support.

- Title
- Weather Balloon Release Jan 4, 2016
- Runtime
- 0:51
- Date posted
- 11 years ago
- Description
- Watch the weather balloon released this evening, 1/4/16. We release these twice daily to gather data above the earth's surface -- temperature, humidity, and wind data. These balloons typically travel nearly 20 miles high before popping!

- Title
- NWS Miami Weather Balloon launch - Nov. 29, 2015
- Runtime
- 0:29
- Date posted
- 11 years ago
- Description
- Watch our weather balloon go up, up, and away on the evening of Nov. 29, 2015! Data from this balloon launch is gathered for input into weather models and for local forecasters at NWS Miami to assess the state of the atmosphere above the surface.

- Title
- Hurricane Joaquin South FL Briefing
- Runtime
- 1:09
- Date posted
- 11 years ago
- Description
- NWS Miami briefing on Joaquin
- Title
- Rotation as seen from NWS Miami along the Atlantic sea breeze!
- Runtime
- 0:18
- Date posted
- 11 years ago
- Description
- Sep. 20, 2015 - Watch the rotation in the clouds, caused by a northwest wind encountering a northeasterly wind behind the Atlantic sea breeze front. Pretty cool!
This is why we watch thunderstorms that develop along sea breeze fronts very carefully as funnels and even tornadoes can sometimes develop.

- Title
- Funnel cloud - Sep. 16, 2015 as seen from Pembroke Pines, Florida looking north
- Runtime
- 1:01
- Date posted
- 11 years ago
- Description
- This video (taken by NWS employee Dennis Feltgen) shows a funnel cloud which did touchdown and produce a tornado in parts of Davie and Southwest Ranches on the evening of Sep. 16, 2015.
A storm survey was conducted and it was determined that an EF-0 tornado occurred. The tornado first touched down in Imagination Farms north of Griffin Rd. The tornado lifted very close to Griffin Road, then touched down again in Ivanhoe Estates. Mostly tree damage occurred, but there was some tile damage to homes observed in Ivanhoe Estates.
- Title
- NWS Miami Briefing on Tropical Storm Erika
- Runtime
- 1:48
- Date posted
- 11 years ago
- Description
- Fri., August 28, 2015